

Global greenhouse gas emissions edged slightly lower in November 2025, offering a narrow but telling snapshot of how uneven the world’s climate trajectory remains, according to newly released data from Climate TRACE, an independent coalition that tracks emissions at unprecedented geographic and sectoral detail.
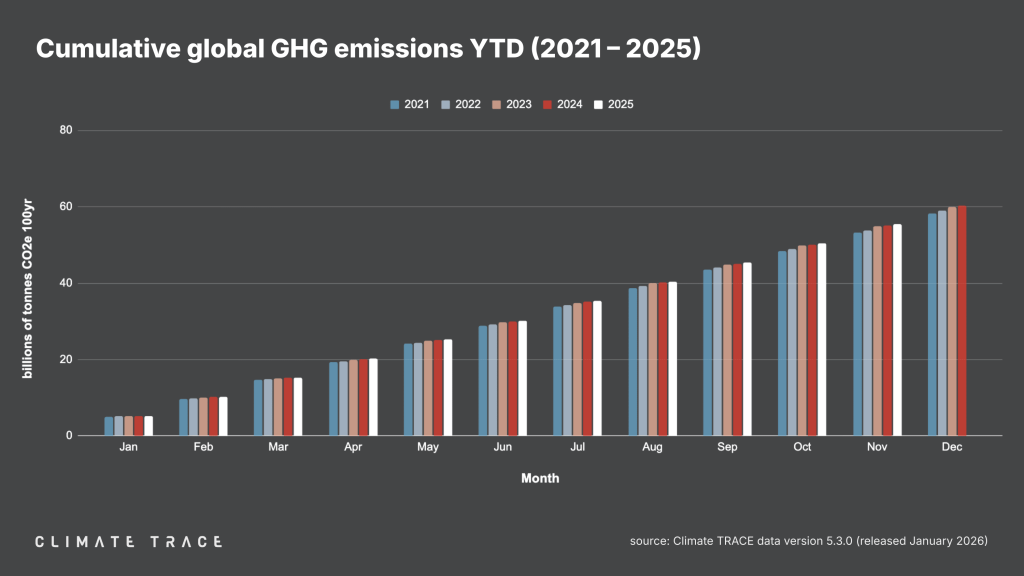
The latest dataset, released under version 5.3.0 of Climate TRACE’s global emissions inventory, estimates that total greenhouse gas emissions for November 2025 reached 4.98 billion tonnes of carbon dioxide equivalent. That figure represents a marginal decline of 0.04 per cent compared with November 2024. Yet on a cumulative basis, the broader picture is less reassuring. Year-to-date global emissions now stand at 55.39 billion tonnes CO₂e, around 0.5 per cent higher than the same period last year, underscoring how monthly dips have so far failed to translate into sustained global reductions.
Methane emissions, a growing concern for climate scientists because of their high short-term warming potential, continued to rise. Climate TRACE estimates show global methane emissions of 33.38 million tonnes in November 2025, a 0.05 per cent increase year on year. While small in percentage terms, the increase reinforces warnings that gains in carbon dioxide mitigation are being offset by slower progress in agriculture, waste management and fossil fuel operations.
At the country level, November’s data highlight how shifts in emissions remain highly concentrated among a handful of major economies. China, the world’s largest emitter, recorded an estimated 1.42 billion tonnes CO₂e in November 2025, marking a year-on-year decline of 0.35 per cent. The European Union, assessed as a bloc, also saw a notable reduction, with emissions falling by 2.31 per cent compared to November 2024. These declines contrast with increases in the United States and Indonesia, where emissions rose by 0.91 per cent and 0.47 per cent respectively. India and Russia both posted modest year-on-year declines.
For Africa, the relevance of these global shifts lies less in headline totals and more in what the data reveal about structural drivers of emissions. Climate TRACE’s monthly breakdowns show that power generation remains the single largest source of global emissions, accounting for over 1.26 billion tonnes CO₂e in November alone. Encouragingly, emissions from the power sector declined by nearly half a per cent compared to the same month last year, reflecting the gradual displacement of coal and other high-emitting sources in parts of the world.
However, gains in power were partially offset by increases in transportation and waste, sectors that are expanding rapidly across many African cities. Transportation emissions rose by 0.46 per cent year on year, while waste-related emissions increased by 0.48 per cent. These trends mirror on-the-ground realities across the continent, where urbanisation, vehicle imports and underdeveloped waste systems continue to drive emissions growth even as renewable energy capacity expands.
The city-level data provide some of the clearest illustrations of how emissions are becoming increasingly urban. Shanghai, Tokyo, New York, Los Angeles and Houston ranked as the highest-emitting urban areas globally in November 2025. Meanwhile, several industrial and power-generation hubs, particularly in India and China, recorded some of the sharpest absolute changes in emissions, both upward and downward. While African cities do not yet feature among the world’s largest emitters, the granular tracking underscores how future emissions trajectories will be shaped city by city, not just country by country.
Climate TRACE’s dataset is also evolving in scope and accuracy. The latest release incorporates nearly 1,900 new electricity generation assets, primarily biomass power plants, and includes revised data for refineries, petrochemical facilities, rice cultivation and copper mining. Such revisions are a routine part of the platform’s methodology, reflecting the integration of new satellite data, improved models and updated reporting sources.

For African policymakers, investors and sustainability practitioners, the significance of this data lies in its immediacy and independence. With a consistent 60-day reporting lag, Climate TRACE offers one of the few near-real-time windows into how global and sectoral emissions are actually changing, beyond national pledges and long-term projections. As African countries balance development priorities with climate commitments, access to this level of detail will increasingly shape decisions on energy planning, urban transport, agriculture and industrial policy.
November’s figures suggest that while incremental progress is possible, the global emissions curve remains stubbornly high. For Africa, where emissions are still relatively low but rising fast in absolute terms, the lesson is clear: the window to chart a lower-carbon growth path is narrowing, and the data to guide those choices is becoming sharper by the month.
Engage with us on LinkedIn: Africa Sustainability Matters
